Everything you should know about Production Tracking Software
Production tracking software helps manufacturers produce more and reduce costs. Find out how production monitoring drives efficiency in this complete guide.

Manufacturers often struggle to meet their production goals and quickly blame old machinery. In fact, unless we speak about worn-out equipment, machinery can be adapted to newer, smarter workflows that can increase throughput, reduce waste, and become energy-efficient.
How can such goals be achieved with a budget-minded approach? Production tracking software (sometimes called production monitoring software) is one improtant Industry 4.0 answer.
In this guide, we discuss the value of implementing production tracking software, cost reductions linked to its application, as well as how Factbird fits into this ecosystem.
What is production tracking software?
We can define Production Tracking Software as a system that allows managers and operators to analyse production on the shop floor in real-time. Production data is accessible at any time, and shows valuable data, such as units produced, cycle time, downtime, scrap, energy consumption, throughput volume, etc.
Performance reports based off production monitoring efforts help teams in difference ways:
Maintenance: Historical data is a verifiable asset for locating the causes behind machinery malfunctioning.
Operators: The error reporting process gets automated, reducing the risk of human error influencing decision-making. Stop codes can be tracked and studied for better workflow resolutions.
Finance: Thanks to accurate data, the financial department of any manufacturing company can draft effective strategies to reduce production costs.
Logistics: Since data collection is handled in real-time and accessible to all teams, logistics can improve their workflow, adapting resources according to seasonality whenever applicable. Companies can downsize their logistics facilities by storing only the required raw material and finished goods calculated per month.
Production tracking software not only serves to collect and analyze data, but it can also help to refactor old machinery into automated systems without hefty investments. This is a point we shall discuss later on.
Learn more about Factbird's world-class manufacturing production tracking software >
Why does production tracking matter?
Companies with production volumes over thousands of units per month require complex processes to track output, resources consumed, machinery status, human resource expenses, etc. We can categorize some of the data required to analyze the production potential of a factory as follows:
- Target monthly production
- Actual monthly production
- Monthly energy consumption
- Raw material consumption
- Uptime/Shifts
- Downtime (single & accumulated) and its causes
- Scrap and rework counts per shift or line
Manufacturing teams benefit greatly by being able to quickly check these production KPIs at daily or weekly standups. You will benefit from comparing days and weeks in regular meetings, and months and years in executive meetings.
By gathering the required data, managers can estimate how far they are from their potential best production numbers, areas for improvement, and particularly which areas they can impact in the short term with minimal adjustments.
The impact of production tracking on energy consumption
Reducing carbon footprints is one of the main goals of the 2030 agenda in terms of environmental preservation. Industrial manufacturing is labeled as the leading cause of carbon dioxide emissions, but other relevant elements that companies consider are:
- Energy prices and the impact on the product price
- Switching to sustainable energy sources
- Optimizing the energy consumption per produced piece
An example of this trend is linked to machinery downtime. Some factories opt to leave equipment in stand-by mode during weekends, with reduced energy consumption compared to operative time. This practice minimizes the loading times for machinery during shifts, but the accumulated energy required in idle mode shouldn’t be overlooked.
By adopting a manufacturing production monitoring system, managers can get readings on the total energy consumed by period, comparing the values between operative time and stand-by. In our Case Study from Danfoss DK, the information provided by the Factbird Performance Dashboard revealed it was more cost-benefit to shut down the machinery during the non-operative time completely. Thanks to these findings, Danfoss DK reduced energy bills by nearly 77% thanks to this measure and other energy-related adjustments.
You can watch the full interview with Martin Ole Madsen, Manager – Operations Excellence SVS EUR at Danfoss below.
Reducing energy consumption instantly translates into a lower final product price. Collecting and analyzing data is the first step toward energy management. Organizations can then opt for their custom strategies to reduce energy requirements in production or go for the ISO 50001-2011 guidelines on energy saving.
The Iimpact of production tracking on throughput
Accurate data collection is the first step towards increasing throughput. Managers often downplay the actual production capacity when non-expensive improvements can significantly impact throughput.
After we get reliable data sources and the workflow established for each product line, it is time to locate bottlenecks. Some countermeasures to prevent production delays are linked to inaccurate speed rates or feed rates for raw material; oftentimes, the causes are related to operators' misunderstanding of machinery.
The application of the smart manufacturing models of the internet of things helps us troubleshoot, reducing equipment downtime, preventing unnecessary wear for machinery, and getting closer to ideal cycle times. As a result, we can see a considerable increase in throughput numbers in just a matter of weeks without resorting to hefty machinery upgrades.
The impact of production tracking on waste management
Implementing a lean thinking approach to industrial manufacturing is not only about identifying losses in production. Consider both time and scrap waste as elements you should aim to minimize as much as possible.
An operator watinng around due to a production line downtime is lost potential. This can be easily fixed by addressing the causes behind repetitive stops and setting up smarter processes for monitoring and eliminating stop causes. Accurate data gives less room for guessing since decisions are made based on facts, and in turn, manufacturers see an increase in production and motivation from their workforce.
The other point to consider is scrap waste. From the OEE standard for Quality, “Right First Time,” manufacturing process analytics give us insights into the volume of scrap produced per shift. This task used to be manually done by operators (with the immense amount of time associated with it). Managers can then crosscheck data to link stop causes with the scrap count or tailor their batch production to avoid machinery warm-up cycles. On this point, the advantage of production tracking is reducing raw material consumption and waste volume on the shop floor.
Benefits of production tracking software
Benefit #1 - More effective equipment
It's correct to assume that legacy machinery works at different cycles than what modern machines bring to the shop floor; still, that doesn’t render them useless. There’s a hidden potential in old machinery to meet today’s production standards, and thanks to monitoring software, the required parameters can be set.
Imagine your company is evaluating a costly upgrade for your two main production lines. What if you invest less than one-third of the money required to optimize your current production lines instead of getting new equipment? Indeed you shall be surprised at the new production metrics obtained from reliable data sources.
Benefit #2 - Automated scrap counting
This is traditionally performed by operators manually, meaning that a group of operators have the sole task of counting the waste produced by machinery instead of using that human workforce at another place more relevant to their skills. Production monitoring software solutions allow us to automatically count scrap, which also gives us better feedback on OEE analysis.
We can then associate the scrap count with other factors such as stop causes, raw material batches, maintenance requirements, etc.
Benefit #3 - Predictive maintenance
For operators and maintenance crews, production monitoring software enables the tracking and anlysis of all stop causes and maintenance actions. Instead of repeatedly putting out fires, maintenance teams can use predictive maintenance models to reduce downtime inthelong term.
What should good performance tracking software include?
Now that we exposed the benefits of using production tracking/monitoring software, let’s summarize what is required from a quality solution:
- 24/7 data access: This is a no-brainer, as the more data available, the better understanding we get of what’s happening with the production. A good performance monitoring solution gives access 24/7, regardless of the device used to browse data.
- Clear data showcase: Data needs to be collected and interpreted by operators and managers. Neatly accessing the information helps to address issues in shorter times, with a better understanding for new workers.
- Data protection: Since we talk about sensitive data, it is best to ensure the final destination of the gathered information. Inquire about the software provider’s method for processing your information, where that data would be stored, also who has access to it.
- Multi-platform access: Don’t render the performance monitoring software to just shop floor monitors and computers. The information should be browsable from tablets, mobile devices, and computers without requiring dedicated hardware solutions.
Types of Production Monitoring Dashboards
There are different models of production monitoring dashboards that operators and managers can use depending on the necessities of their work.
OEE dashboards
OEE calculations no longer require to be manual or to use third-party software solutions. Most production monitoring software performs the OEE calculation in live time, with graphics that break segment by segment the OEE values and each individual metric.
From these dashboards, we can extract information about the quality of our products based on the “Right First Time” principle, the total operative time and total available time for manufacturing, and the stop causes or planned stops.
Shop floor dashboards
These performance dashboards display a simplified blueprint of your shop floor structure, indicating the location of each relevant machine in the production process. It becomes a valuable asset since you can track the exact location of raw materials and produced parts and estimate logistics capacity. Information is also displayed about OEE and the status of machinery (on which ones are currently produced and the ones idle).
Daily production dashboards
It becomes essential to track the performance of our production resources. The daily production dashboards express the throughput per day in bar charts - sometimes, they allow for smaller time intervals. Target production goals are displayed, so you can evaluate where your production performance stands.
Interactive stop registration screens
Finally, using this type of dashboard helps us analyze the causes behind stop errors and mainly the accumulated impact of reiterative stop causes. Operators tend to minimize stops that are short. Still, experience tells us that micro downtimes often bring a high amount of accumulated inefficiency. Therefore, these dashboards provide detailed elements managers should study to improve production performance.
Problems solved by production tracking software
Lack of overview of production performance
As we mentioned before, managers often underestimate the real potential of their machinery for production. Considering the methods applied to track production before industry 4.0 models, we start by getting data from sensors to PLC. That data is distributed to an Excel spreadsheet in which information is tracked. This legacy process involves a good deal of steps that can fall prey to human-error factors such as:
- Incorrect data count, especially for scrap and pieces to be reworked.
- Delay in data input, which hinders the ability to take action.
- Inaccurate data input in spreadsheets.
- Misunderstanding of the data.
- Distribution issues.
Using Excel sheets also involves complex template designs to track the information. Tools such as RSLinx are required to export the data from PLC to the Excel document. Just a couple of wrong-placed clicks and all data reports could be messed up. Instead, manufacturing process monitoring software simplifies the process, syncs it for easy access, and estimates the real production potential based on the ideal cycle information.
OEE analysis
OEE calculation, when done manually, can lead to a broad range of errors. From underestimating the production capacity (which leads to OEE values over 100% when production is optimized) to incorrect scrap counting, the process can seem tedious when it can be automated. OEE software solutions included in manufacturing monitoring software perform the calculation in real-time, offering insights into which stop causes are lowering the OEE values.
Prioritization
This point is linked to the OEE analysis, as the information retrieved by the manufacturing monitoring software solution gives clues about which areas are ready to be optimized. With the information retrieved on both stop causes and current production rates, management can decide on these items:
- Maintenance agenda
- Shop floor upgrades
- Workflow revisions
- Raw material quality
- Tactics to prevent waste (energy, rework, and scrap).
Stop causes
Stop causes, especially repetitive ones, are complex in terms of locating their origin. Stop errors that are comprehended between the 300-500ms gap can seem like nothing; still, they are the culprits of multiple delays in product delivery.
Production monitoring systems give precise feedback on which and when stop causes happened. Operators can then influence several of them, escalating the issue to management when the solution exceeds their reach. Moreover, counting with alerts when stop causes are triggered helps to instantly fix the solution rather than spot the problem when production is delayed.
Decision-making based on facts
As information becomes an accessible source, manufacturing processes can transition to lean manufacturing, where production is optimized, and waste is minimized. Managers can evaluate the current production metrics based on the data retrieved by the sensors and develop strategies purely based on factual information. When the budget is restricted, this point becomes an invaluable asset.
How can Factbird help companies escalate in production volume?
Factbird is a comprehensive solution for manufacturing monitoring that goes beyond OEE tracking. You get accurate downtime analysis to increase availability rates, predictive maintenance suggestions, batch performance tracking, and plenty of other tools at your disposal.
Users can track live and historical data and register as many different stop causes as required.
Factbird is scalable as a production monitoring solution. By this, we mean that companies can start with a pilot on a limited number of machines/lines, then add new units to ultimately cover the machinery volume required.
Factbird’s compatibility (ERP/SAP integration and PowerBI)
You don’t need to ditch previously acquired tools to use Factbird. Our software solution allows us to easily export data from the Factbird app to PowerBI, Tableau, etc. This allows companies to preserve their existing analysis workflows, supplementing those tools with accurate data readings and easier-access information on the shop floor.
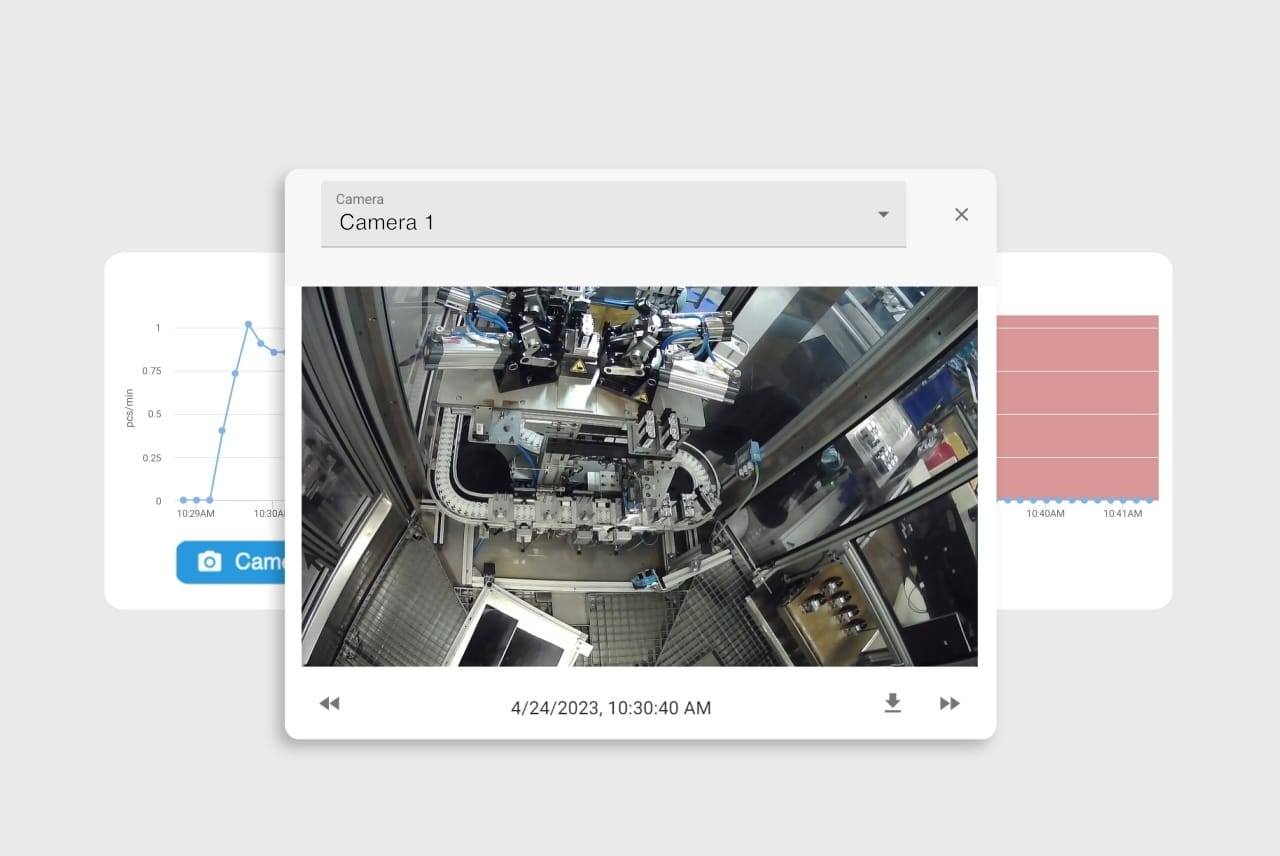
Factbird VIEW
Picture yourself getting real-time video footage of what’s going on in the production lines. Well, Factbrd VIEW reduces the need to interpret error causes by just browsing via video what caused a line to stop.
By collecting video images in real-time and syncing them with production data in the Factbird Cloud Application, users can check at any moment required the situation that triggered a stop cause. Videos are synced minute-by-minute with the production data, making it easier to browse for the causes of a stop error.
This video information is sharable, so maintenance crews get detailed reports on which issues they should work on. Video footage is preserved in the server up for a month as a standard, but you can request custom settings during the installation phase.
Data protection
We care about our customer’s data. The information collected by the Factbird sensors is uploaded to the cloud to be accessed via the Factbird dashboard, and only users with credentials can access that information. If your password doesn’t work, you can ask our customer support to assist you in recovering the login information.
No data downtime can be linked to a lack of connectivity, as the Factbird solution can work on mobile data, WiFi, or Ethernet.
How to install Factbird Production Monitoring Software
Implementing Factbird's technology on your shop floor is a task that requires only a couple of hours of installation. No extra IT resources are needed to install our Factbird solutions, and the data-retrieving process is instant. This section will give you a quick overview of how to install and use the Factbird manufacturing metrics dashboard to control your processes.
First, here's an overview of how Factbird's Manufacturing Intelligence Solutions work.
Accessing the Dashboard
The first step is to validate your account, to which you shall get an email from our company with a temporary login credential. Change your password in the browser, and you can log into Factbird’s monitoring dashboard.
The initial stage of the dashboard won’t retrieve any data, as sensors ought to be configured. Browse for the upper left corner of the Factbird dashboard, and access the sensor menu.
Configure a Sensor
In order to configure a sensor, you should first specify its type. Options are as follows:
Counter: A regular counting sensor, which transmits the count since the last publish.
Counter Speed: A speed sensor converted into a counter.
Counter Accumulate: An accumulative sensor converted into a counter.
Measurement: A sensor that tracks the direct value of measurements such as temperature, speed, pressure, etc.
Event: An event sensor, which triggers on status change.
Discrete: A sensor that transmits one of a limited number of states a line can be in.
Manual Process
Next, you have to update the values for both the Validated Speed and the Expected Speed for the equipment. Switch to the Units tab and select the Unit Data to track.
Define stops by selecting the Minimum Stop Duration (usually, values higher than 300 ms) and the Stop Registration Threshold. It is advised to turn on Enable Finding Stops, as it allows to detect stop causes automatically.
Stop Mapping works for machinery connected to PLC inputs. Line Setup can be handled from this Sensor Settings menu or independently.
The final step is to set the Alerts and link the subscribers. The team members will be notified after a stop cause goes over the minimal threshold selected. Repeat all these steps as often as required to configure all the sensors.
Creating a Line
We start the line-creation process by accessing Lines on the navigation menu. You need first to select the group in which the sensor is located - you can work with pre-defined groups or create your own.
The second step is to select the bottleneck. This is the primary sensor of that line and should be placed at critical points of the production line. Proceed to name the line and assign the connection (WiFi or Ethernet, depending on your sensor model). Repeat this process to add as many lines as required.
Dashboard KPIs
After our entire network of sensors and lines is created, Facbird’s system will track and analyze the data. Our dashboard includes several KPIs to review the equipment’s performance.
The KPIs we can study are:
- Produced count
- Longest non-stop
- Number of Stops
- Average Stop Length
- Downtime
- Value Adding Time (%)
- Value Adding Time while Manned (%)
- Mean Time Between Failures
- Average Produced
- Cycle Time
- Produced Units per Stop
- Speed While Manned (pcs/min)
- Speed While Producing (pcs/min)
- Produced in Current Batch
- Estimated Time of Completion
It is possible to view and analyze data by pre-established time ranges or even highlighting periods from the graphs to study data in more detail. The information provided by the KPIs sections can be visualized in the form of graphs for better understanding. Stop causes will be listed below the graphs.
This information can be exported in graphs or KPIs format for data analysis with third-party tools.
Registering Stops
Using the Register Stops tab is an efficient method to address the causes of reduced available time. We can work with as many categories or stop causes as required, and for this, we provide users with a template to shape the most common categories & stop causes. Import the XLSX file into the Registering Stops menu, which you can modify to add extra items. This procedure is user-friendly, and by exporting the XLSX file from one line, we can sync categories and stop codes to other production lines.
As an extra safety measure, enable the Require Initials option. This feature requires operators to input their initials when reporting stop codes and helps build historical data.
Another exciting option is to manually split stop causes, add extra information or change stop causes/categories for prolonged stops.
Analytics & OEE
The analytics tab is a powerful tool for operators, maintenance crew, and managers to visualize what’s happening with the equipment and production quality in real time. Manufacturing productivity metrics are tracked in detail, allowing us to visualize data in different formats that suit our preferences. These graphs can be exported to other software solutions to create reports.
Our OEE calculation tool works in real-time, measuring TCU, OEE3, OEE2, and OEE1 in bar charts and waterfall visualizations. The data gathered gives accurate insights into all three parts of the OEE formula, with access to stop causes for quickly reverting factors that hinder our OEE values.
Andon Calls
Another premium feature we list on Factbird’s software solution is Andon Calls, and this tool helps operators to get assistance on error causes, even escalating the issue to specialized crew members.
The Workers Tab helps us to keep the contact data of team members. This requires the worker's phone number, email, shift, and rank. Shifts can be configured to allocate as many shifts as required. Workers can occupy places during Temporary, Semi-Temporary, or Permanent positions.
Accessing the Calendar allows us to visualize the total number of employees working during a shift.
Batch Production
Factbird’s software gives the option to analyse certain products in batch mode, entirely automated. In order to do that, you first have to create a product, specify all its parameters, and save it. If your machinery allows batch production, a sensor is placed, and the Batch tab shall appear on Factbird’s dashboard.
Next, create a batch. Select the product that shall be produced in batch, the amount of units, and the start type. After the process starts, you will get an estimated completion time, and you can analyze the process in real-time with the analytics tab. It is an advantageous solution for industries like pharmaceuticals.
Closing thoughts
Production tracking systems benefit manufacturers with cost savings, energy consumption reductions, and increased production.
Operators, production managers, and executives gain an increased understanding of what’s happening inside the production line, in real-time, aligning teams behind continuous improvement and getting more out of their existing production lines.
Data-driven decision-making thanks to production tracking is a no-brainer for manufacturing teams.
.png)
