How Wozniak Industries drives operational excellence with data

Wozniak Industries, Inc. is a leading supplier of engineered metal solutions with a commitment to precision and timely delivery. They use manual and automatic processes to make parts and have a strong focus on operational excellence across their plants.
We interviewed Lorne Day, VP of Operations, about their manufacturing intelligence transition with Factbird. He highlights how data has helped them improve efficiency, address hidden challenges, and improve their bottom line.
What was your workflow like before Factbird?
We measure ourselves on efficiency, and the efficiency was based on the work order. And it was pretty difficult to measure it. So there was no data to tell us if it was a good day.
When I came in three years ago, one of the things I started using was what I call man-to-base. It's a ratio between man hours worked and machine hours produced, and it gave us a starting point. And as you made efficiency improvements, you would see the man-to-base ratio improve.
The data we were using was extremely manual. It took a long time, and we needed information immediately on an hourly, minute-to-minute basis.
And then, when I heard about Factbird at a golf outing, it got me excited. And that's when we started to look at the opportunities to get a system that allows us to drive behavior with data.
Why did you choose Factbird?
So what really excited me about Factbird were two things:
One was the cost. It was a very competitive cost, and I'm all about cost; that's how we run our business.
And two, it was about whether we can customize it to look the way I wanted it to in order to understand the data.
When I talked to other companies about how we measure performance, or OEE, they said, “Here it is. Here's what it's going to look like.”
And for me, it wasn't what I wanted it to look like. I wanted a particular report that made sense to me and the team to make decisions.
How many production lines are you tracking?
As of today, we have five lines. We have three auto presses, we have a leveler, and then we have what we call a put and take, which is a manual press.
I can see the data every day. I can see it every hour. I can sit in my corporate office and see how we're performing.
We've loaded all the information about every part number we run. We know what we should run. We can evaluate if we're hitting, on an ongoing basis, the number of pieces per hour.
So they're all running. It's working well, and we're evaluating that every day.

How do you collect production data?
It's a plug-in tool. It ties into your PLC. It was fairly simple to track production.
But, like any implementation, it's a learning curve. We had learning curves because every PLC is different. We have a PLC for presses, another plant has PLCs for induction, another has PLCs for machining.
All talk different languages. And so each one is going to be a little learning curve. But once you do one and know how to do one, the rest are easy.
Barcoding came in for reason codes (stop causes). Just hit a barcode reader, and you get a reason code.
We started out with between eight and ten reason codes that, if you're on break, if we had a changeover, if we had a coil change, we were able to scan it and know the time it took.
So, for example, one area where we work with barcodes is coil changes. I believe a coil change should take 20 minutes. They scan, they start the coil change, and they finish. It starts. And we scan it again. I know the time limit, and when we're past the time limit, there’s a root-cause corrective action that has to happen.
We want simplicity. We don't want an operator writing things down. We want an operator to barcode it, cycle start, and run it.

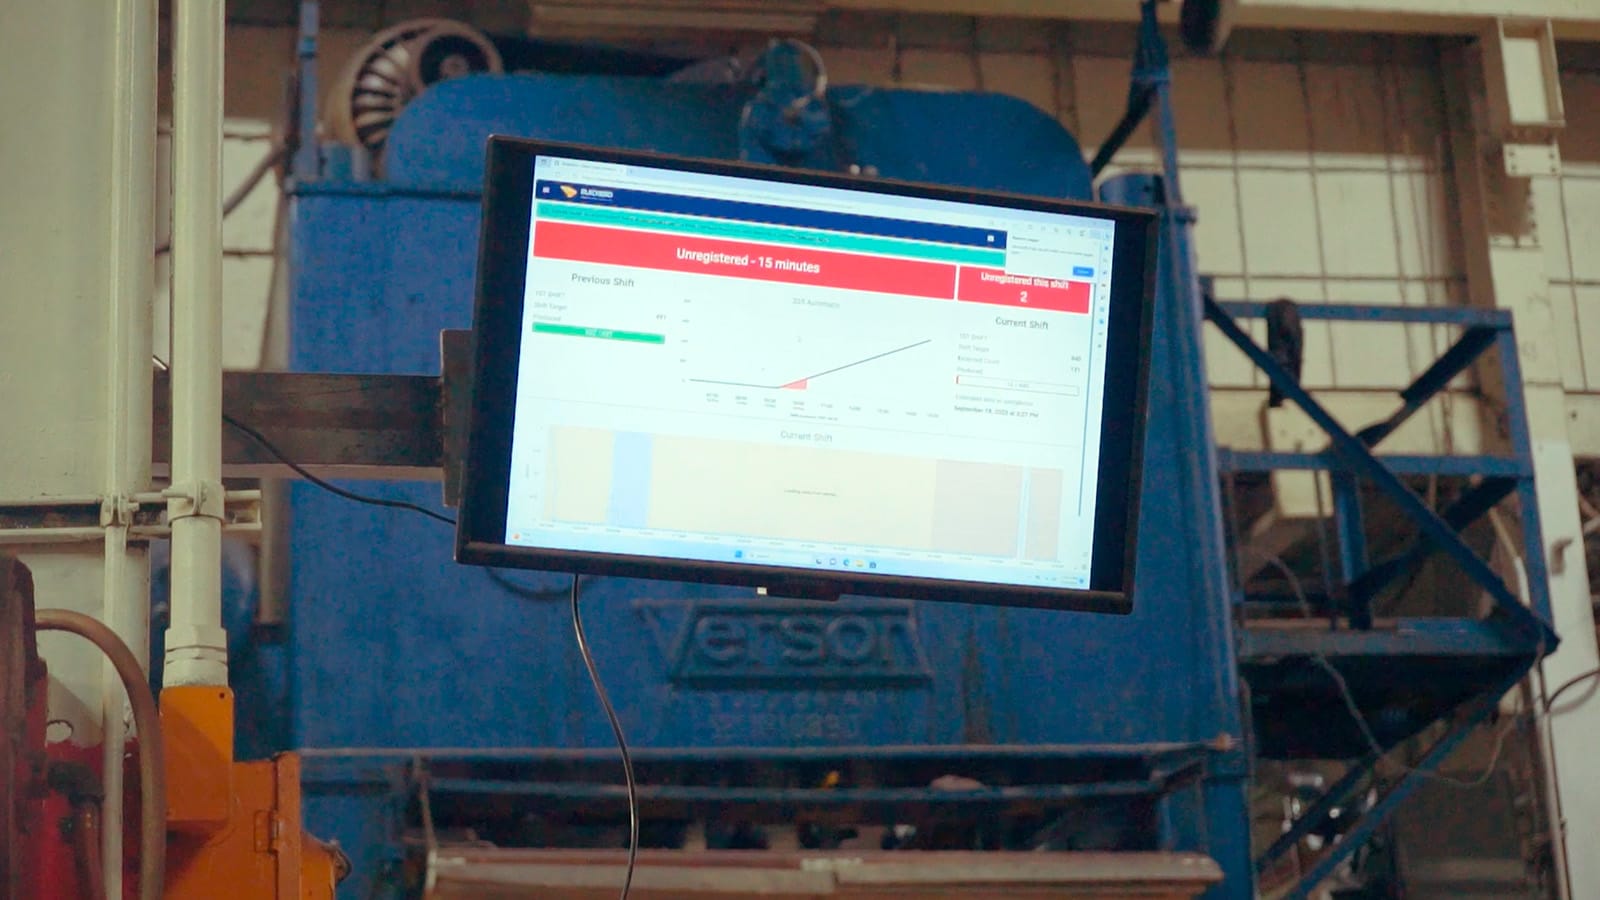
How do you analyze efficiency?
With Factbird, we were able to manipulate data and work with Factbird to provide us what we wanted to see. The Paynter chart is exactly how I want to see it.
I can click on each operation, and I can go look at incidents, about how many breaks, or how many times there were coil changes or tool changes. And I can click on another button that tells me, of those incidents, how long they took.
Every day I get the report in the morning by five. I look at the report for whatever press I'm gonna look at, and I can click on the minutes that we were down for the reason codes, lunch break, maintenance, coil change, tool change, whatever it may be.
That, to me, is huge. That's what changes behavior. And it's not about colors and all the bells and whistles. It's about simplicity to me. And I'm a simple guy, you know, I want simple data. I want data everyone can understand.
Why do you prefer Paynter charts to Pareto charts?
The problem with Pareto analysis is that you could be attacking the wrong problem.
You want to attack problems that reoccur every day. With pareto charts, the biggest bar could have hit once, and it’s your biggest line.
Paynter charts are all about attacking reoccurring issues. A Paynter chart gives you that information because you have days across the top, incidents right here, and it measures all that.
A Pareto chart just says downtime with a big bar. This doesn't tell you how often it happens.
So that's why I went with Paynter charts, and I believe if you're running a business, you really want to know what's going on every day and why it's going on.
How are you using Factbird to improve?
The onus is on us now. It's on our leadership to make sure we're making the right decision.
It's just a tool, right? It's telling us we have an issue. That's what we need. We need something to tell us, you have an issue or you had a great day.
Every day, we want to know OEE1, OEE2, and OEE3. And my OEE2 baseline is 60%, and that's the starting point. I'm not even there yet. So, we've come from 30%, and now we're running at 45–50%. I don't think we could have done that without Factbird because we did not have information to let us know that we had opportunities.
And when you're talking 10%, that's a tremendous amount of money you're saving. And if you're only at 45–50%, imagine when we get to 80%.
Factbird is just a tool; nothing changes unless you change. It's about information to drive behavior and improve our operational excellence. And if we're not forming material, we are losing money.

How easy was it to implement Factbird?
We didn't have to bring in anybody new into our company in order to run it. We have an ME [Manufacturing Engineer] who has done a fantastic job; he’s our corporate expert now. We don't have to knock on Factbird’s door every time we have an issue.
I believe in the first two, say a couple of months, we were comfortable. It took a while for the barcoding. It was new. It took a while for us to define how we want the Paynter chart to look.
I could tell you this was probably less than a three-month ROI for us. It's a very affordable tool.
And if you can't save money within the first quarter, if you can't pay it off in the first quarter, then it's not the tool's issue.
How did you change culture?
We're so used to asking what happened when there is a problem. But when an operator has a good day, you need to be out there and say, Here's the data. The data tells me you had a fantastic day. Thank you.
And the question is, what happened? Why did we have a good day? Why did it take only 20 minutes? Everything hit where it was supposed to hit, because that's what you want to know.
If you have the tool and you just look at it, not asking questions, behavior is not going to change. Behavior only changes when you ask questions.
Every penny I spend on any asset, and this is an asset, it’s about ROI, right? And it initially came across that this is something that Lorne wants to do, and that's the wrong thing. I probably presented it wrong. This is a tool that we need to be successful, to keep these doors open.
So this is our tool, not my tool. That's the culture you have to shift on. You have to get buy in. It's all about the why. Everything's about the why.
People don't mind change, they just mind being changed. And so this is a change in behavior. This is now holding leadership accountable. It's not necessarily holding the operators accountable. It's holding leadership accountable for doing the process that you put in place and using the data.
Has Factbird helped you increase uptime?
For us, Factbird, it's all about uptime. It's all about the presses or the leveler going up and down or moving. If we're not forming parts, we are losing money every minute.
I would have to say, if you look at a measure for it, our pieces per hour is up by about 20 to 25%.
We were running overtime. And now, actually, we're talking about, “Hey, with the current level of production, we may have to start offering maybe people some time off.” So it's a significant reduction in our costs.
It's paid for itself already. You know, I know when I first brought it in, my leadership was like, “We got to pay for something else?” I'm like, this is going to pay for itself in no time.
Why do you think data is so important?
We're in a world of efficiency. We're in a world of dog-eat-dog, you know, and there's always someone less costly out there because they're better than you.
And the reason why they're better than you is that they have a tool that they use better. Because their machines, their presses are the same, they go up and down. It's how you run it. It's how you use the data, and make the changes you need to make.
Everything we do is about operational excellence. You can be a great player, you can be a great engineer, you can be a great this, a great that, whatever. But if we're not great in operations, it doesn't matter how good everybody else is; we're done.
.svg)
.svg)